Statistics Report
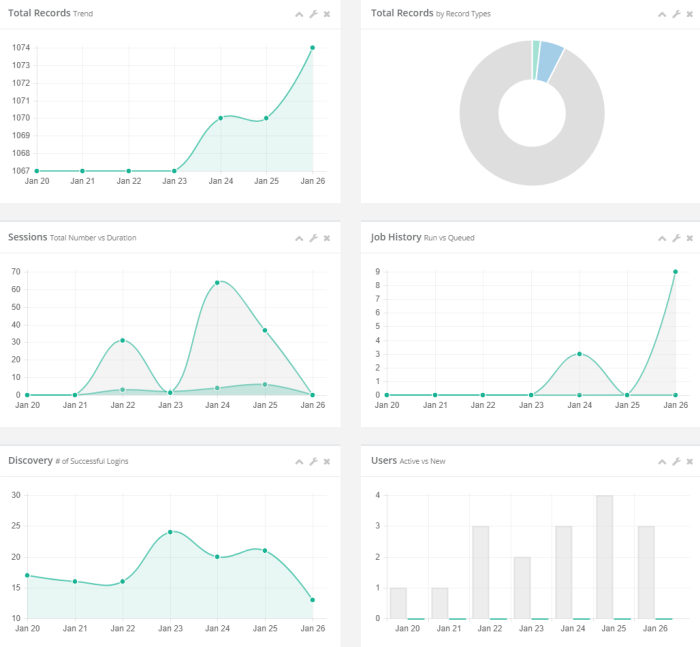
The Statistics report provides a graphical understanding of various categories of objects throughout the PAM system as well as trending data over a 7 day period.
Statistics are gathered once per day using an automated system task.
Available graphs
The following graphs are available in the Statistics report:
Total Records Trend: Displays a line chart of the total number of records in PAM over the past 7 days.
Total Records Count: Displays a pie chart of the total number of records currently in PAM by Record Types.
Sessions: Displays a comparative line chart of the total number of sessions vs duration (in minutes) per day over the past 7 days.
Job History: Displays a comparative line chart of the total number of run vs queued tasks per day over the past 7 days.
Discovery: Displays the total number of successful objects found during discovery per day over the past 7 days.
Users: Displays a comparative bar graph of the number of new vs active PAM users per day over the past 7 days. Active indicates at least one login to PAM during a day.
